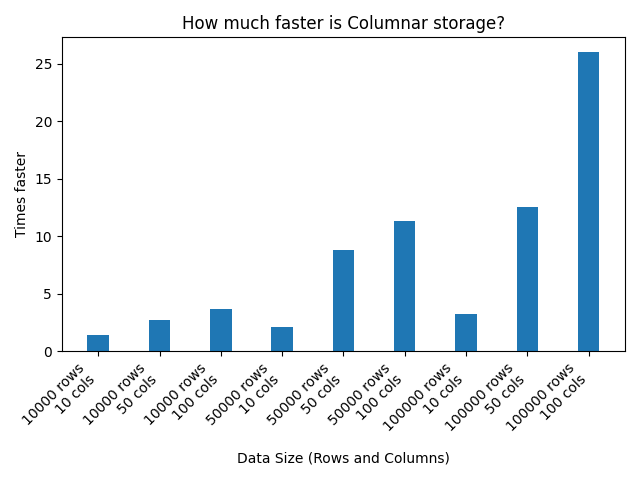
How fast is row-oriented storage compared to columnar storage?
How fast is row-oriented storage compared to columnar storage?

Introduction
In this post, we talked about how columnar storage is faster for certain read patterns (reading a few columns of a table).
Now, let’s experiment and see how much faster for a particular use case. We’ll write tables of different sizes to disk in both row-oriented and columnar storage. We’ll then read the 3rd column of each row of the table from both storage formats and compare the read times.
Results
Here are the results:

Code
And here’s the code:
"""This script compares the *read* performance of columnar storage with row-oriented storage.

This script writes tables of different sizes to disk in both row-oriented and columnar storage*.

It then reads the 3rd column of each row of the table from both storage formats and compares the read times.

It prints some nice graphs to show the results.

*This is a lie (but helps ease understanding). The content written is junk so it doesn't matter the "format"
we write in as long as the size num_rows*num_cols. When we read, that is when we either do a row-oriented read
or a columnar read, and compare those times.

Note: This script requires root access to drop disk caches. You can run it with sudo or wait when prompted to
enter your password.
"""

import os
import time
import matplotlib.pyplot as plt
import numpy as np


def drop_disk_caches():
    """Drop all the disk blocks the OS has cached to memory."""
    os.system("sync; echo 3 | sudo tee /proc/sys/vm/drop_caches")


def write_table(filename, num_rows, num_cols):
    """Write a table of a certain size to disk. The data is junk, we only care about the size."""
    with open(filename, "wb") as f:
        total_write_length = num_rows * num_cols
        f.write(b"2" * total_write_length)


def read_row_oriented(filename, num_rows, num_cols):
    """Read field 3 of each row from row-oriented storage."""
    with open(filename, "r") as f:
        # read the whole thing and keep only field 3 of each row
        trash = (
            f.read()
        )  # we don't care about the data read, we just wanna measure read time


def read_row_oriented_seek(filename, num_rows, num_cols):
    """Read field 3 of each row from row-oriented storage using seek (i.e. don't read *everything*, seek and read, seek and read, etc)."""
    with open(filename, "rb") as f:
        row_len = num_cols
        f.seek(2)  # move to 3rd byte of the first row
        for _ in range(
            num_rows
        ):  # TODO python loops are slow, this may contribute significantly to the time
            trash = f.read(1)  # read the 3rd byte
            f.seek(row_len - 1, os.SEEK_CUR)  # skip to the 3rd byte of the next row


def read_columnar(filename, num_rows, num_cols):
    """Read field 3 of each row from columnar storage."""
    with open(filename, "rb") as f:
        # seek to the spot containing all field 3 values (i.e. column 3)
        f.seek(2 * num_cols)

        # read all these values
        trash = f.read(
            num_rows
        )  # see you only do 1 contiguous read, this is why columnar storage is faster for this use case


def measure_read_time(rows, cols, use_seek):
    """Measure the read time of columnar and row-oriented storage for a table of a certain size.

    Args:
        rows: The number of rows in the table.
        cols: The number of columns in the
        use_seek: Whether to use seek to read row-oriented storage.

    Returns:
        A tuple containing the read time for row-oriented storage and columnar storage.
    """

    write_table("data.dat", rows, cols)

    drop_disk_caches()

    # read (and time) from row-oriented storage
    start_time = time.time()
    if use_seek:
        read_row_oriented_seek("data.dat", rows, cols)
    else:
        read_row_oriented("data.dat", rows, cols)
    row_duration = time.time() - start_time

    drop_disk_caches()

    # read (and time) from columnar storage
    start_time = time.time()
    read_columnar("columnar.dat", rows, cols)
    col_duration = time.time() - start_time

    return row_duration, col_duration


def save_bar_graph(results):
    fig, ax = plt.subplots()
    index = np.arange(len(results))
    bar_width = 0.35

    row_durations = [result[2] for result in results]
    col_durations = [result[3] for result in results]
    labels = [f"{result[0]} rows\n{result[1]} cols" for result in results]

    rects1 = ax.bar(index, row_durations, bar_width, label="Row-Oriented")
    rects2 = ax.bar(index + bar_width, col_durations, bar_width, label="Columnar")

    ax.set_xlabel("Data Size (Rows and Columns)")
    ax.set_ylabel("Read Duration (seconds)")
    ax.set_title("Read Duration Comparison: Row-Oriented vs Columnar Storage")
    ax.set_xticks(index + bar_width / 2)
    ax.set_xticklabels(labels, rotation=45, ha="right")
    ax.legend()

    fig.tight_layout()
    plt.savefig("read_duration_comparison.png")


def save_ratio_graph(results):
    fig, ax = plt.subplots()
    index = np.arange(len(results))
    bar_width = 0.35

    ratios = [result[2] / result[3] for result in results]
    labels = [f"{result[0]} rows\n{result[1]} cols" for result in results]

    rects = ax.bar(index, ratios, bar_width, label="Row-Oriented / Columnar")

    ax.set_xlabel("Data Size (Rows and Columns)")
    ax.set_ylabel("Times faster")
    ax.set_title("How much faster is Columnar storage?")
    ax.set_xticks(index)
    ax.set_xticklabels(labels, rotation=45, ha="right")

    fig.tight_layout()
    plt.savefig("read_duration_ratio.png")


def main():
    row_counts = [10_000, 50_000, 100_000]
    col_counts = [10, 50, 100]

    results = []

    for rows in row_counts:
        for cols in col_counts:
            print(f"Testing with {rows} rows and {cols} columns")
            row_duration, col_duration = measure_read_time(rows, cols, False)
            results.append((rows, cols, row_duration, col_duration))

    save_bar_graph(results)
    save_ratio_graph(results)


if __name__ == "__main__":
    main()